


TNFD-Aligned Disclosure
Information disclosure in line with TNFD recommendations
TNFD (Taskforce on Nature-related Financial Disclosures)*1 recommended in September 2023 a framework to identify, evaluate, manage and disclose nature-related issues in business activities.
Anritsu registered as a TNFD Adopter*2 in May 2025. We began disclosing information in line with the TNFD recommendations in FY2025 and will continue to gradually expand the scope of such disclosure.
Scope of disclosure as of August 2025
| Governance | A. Board's oversight of nature-related dependencies, impacts, risks and opportunities B. Management's role in assessing and managing nature-related dependencies, impacts, risks and opportunities |
| Strategy | D. Priority locations for the organization's direct operations |
| Risk and Impact management | C. Processes for identifying, assessing, prioritizing and monitoring nature-related risks are integrated into and inform the organization's overall risk management processes |
| Metrics and Targets | A. Metrics for assessing and managing material nature-related risks and opportunities in line with strategy and risk management processes |
*1 TNFD: Task Force established in 2021 by the United Nations Development Programme (UNDP) and other agencies. In September 2023, the TNFD published recommendations for companies, financial institutions, and others to identify, evaluate, manage, and disclose nature-related issues. TNFD aims to transform the flow of corporate activities and funds that have a negative impact on nature into a flow that has a positive impact by encouraging the disclosure of information by companies.
*2 TNFD Adopter: A company or organization that has declared its intention to disclose information in accordance with the TNFD disclosure recommendations in reports and other documents issued by the company.
Governance
Anritsu's Board of Directors oversees issues and initiatives related to nature-related dependencies, impacts, and risks and opportunities. The Group CEO is responsible for promoting the various activities.
The assessment and management of dependencies, impact, risks and opportunities are incorporated into the group-wide risk management system, with the Chief Environmental Officer responsible for risk management.
The Chief Environment Officer oversees the Environment and Quality Promotion Department, which is responsible for the Anritsu Group's environmental strategy. The officer also serves as the chair of the Environmental Management Committee and the Global Environmental Management Meetings, thereby ensuring that risks and opportunities are evaluated and managed globally. The Chief Environment Officer periodically reports the results of the annual management cycle of risks and opportunities to the Management Strategy Conference and the Board of Directors and receives guidance and necessary instructions.
The disclosure of nature-related information will be discussed and approved by the Management Strategy Conference each fiscal year as part of the development or review of the Mid-term Business Plan (GLP) and reported to the Board of Directors, which will supervise such disclosure.
Engagement with stakeholders will be promoted with local government agencies and universities.
Strategy
Anritsu will utilize the LEAP Approach*3 proposed by TNFD to develop strategies to address nature-related challenges.
In FY2024, as the first step, we implemented the “Locate: Interfacing with Nature” phase of the LEAP approach and conducted the following evaluations.
- Organizing potential dependence and impact on nature
- Potential business risks and Anritsu's response
- Analysis of priority areas for response in the company's business activities (direct operations)
[Organizing potential dependence and impact on nature]
Anritsu used ENCORE*4, developed by the United Nations Environment Programme (UNEP) and others, to assess the relationship of nature-related dependence and impacts across the Anritsu Group's value chain and in its business activities (direct operations).
Dependence and impact as key points in relation to our business
| Overall value chain | There is significant dependence and impact on nature, especially in processes related to upstream raw material procurement. |
| Water resources are highly dependent on nature, from upstream processes to direct operations. | |
| GHG emissions have a significant impact on nature both upstream and downstream in the value chain, in addition to direct operations. | |
| There are potential impacts on nature from alien species during product transport and waste disposal. | |
| Direct operations | Manufacturing (factories) depends on the flood and storm mitigation functions of forests and rivers. |
| Manufacturing is dependent on water resources and there is a high possibility of particular dependency in the Sensing & Devices business. | |
| There is a high likelihood of significant impact on nature if air pollutants or toxic contaminants were to leak into the soil and water quality. |
- An assessment of the dependence and impact of our business activities on nature is available here
*3 LEAP approach: Framework developed by the Taskforce on Nature-related Financial Disclosures (TNFD) for companies and financial institutions to assess and disclose the dependence and impact of their business activities on nature, as well as risks and opportunities. It consists of four steps: Locate, Evaluate, Assess, and Prepare.
*4 ENCORE: Tool developed primarily by the United Nations Environment Programme's World Conservation Monitoring Center. It is used to analyze the extent to which corporate activities depend on and impact nature, and to identify risks and opportunities.
[Potential business risks and Anritsu's response]
Anritsu has identified business activities where potential risks are anticipated, where the risks occur, and whether they are addressed (see table below).
We will continue to analyze risks and opportunities in detail using the LEAP approach and consider more effective measures.
Risks arising from dependence on nature
| Category | Dependence on nature in business | Benefits of nature for economic and social activities | Economic and social impacts of reduced benefits | Business risks and where they occur | Anritsu's existing responses | |
|---|---|---|---|---|---|---|
| Physical risk *7 | Chronic | Water supply | Supply of water resources | Decreased water supply, water shortage | Upstream: The need to develop new water sources will lengthen the production period and increase procurement costs. | None |
| Direct operation: The production of device products that use relatively large amounts of water may stagnate. |
|
|||||
| Climate regulation | Natural climate regulation (Climate is regulated by soils and plants through long-term storage of CO₂) | Climate change, especially rising summer temperatures | Upstream: Increase in procurement costs due to higher production costs resulting from lower labor productivity. |
|
||
| Direct operation: Increases in electricity costs due to use of air conditioning in response to climate change. |
|
|||||
| Acute | Flood control | Role of vegetation in buffering and attenuating flood damage | Increasing severity and frequency of floods and wind/water disasters | Upstream: Increase in procurement costs due to shorter production periods and changes in production sites. | None | |
| Direct operation: Increases in operating costs due to shortened production periods and additional mitigation facilities. |
|
|||||
| Downstream: Delays in deliveries due to infrastructure damage and road closures, and increases in costs due to high frequency of transportation route changes. | None | |||||
| Climate regulation | Natural climate regulation ( Climate is regulated by soils and plants through long-term storage of CO₂) | Increasing severity of wind and water disasters and flood damage | Upstream: Stagnation of production due to flood damage. |
|
||
| Direct operation: Stagnation of production due to flood damage. |
|
|||||
Risks arising from impacts on nature
| Category | Impact of the business on nature | Relationship with nature through economic and social activities | Business risks and where they occur | Anritsu's existing responses | |
|---|---|---|---|---|---|
| Transition risk *8 | Reputational | Area of land use | Modification of nature through land use in terrestrial, freshwater, and marine areas | Upstream: Damage to brand image and boycotts due to procurement of resources from areas where mining activities have caused degradation and fragmentation of biological habitats. |
|
| Direct operation: Damage to brand image and deterioration of relationships with stakeholders due to failure to conserve local ecosystems by utilizing green space on the project site. |
|
||||
| Introduction of invasive species | Transboundary movement of invasive alien species | Downstream: Damage to brand image by using transport and waste companies that are backward-looking in their efforts to combat invasive species. | None | ||
| Policy | Emissions of GHG | Climate impacts of GHG emissions | Upstream: Increases in costs to comply with stricter regulations on GHG emissions and growing social demands for emissions reductions. |
|
|
| Upstream: Increases in costs to comply with stricter regulations on GHG emissions and growing social demands for emissions reductions. |
|
||||
| Downstream: Increases in transportation costs of products due to enhanced GHG emission reduction measures by transport companies. |
|
||||
| Emissions of toxic soil and water pollutants | Discharge of toxic pollutants | Direct operation: Increased costs to comply with stricter regulations on soil and water pollutants and increased social demands for pollution prevention. |
|
||
| Area of land use | Modification of nature through land use in terrestrial, freshwater, and marine areas | Upstream: Stagnation of component production due to land use restrictions in areas of biodiversity importance | None | ||
| Direct operation: Increases in costs to respond to tighter greening standards and increases in social responsibility in line with evolving domestic and international biodiversity conservation measures. |
|
||||
| Technology | Other abiotic resource extraction | Use of abiotic resources such as metals and minerals | Direct operation: Increases in costs for the development of products and services that contribute to reducing environmental impact, such as resource reuse and recycling. |
|
|
*7 Physical risk: The risk that results from the degradation of nature and the consequent reduction in the benefits that nature brings to the economy and society. Risks can be categorized as acute (risk due to the occurrence of short-term, specific events) or chronic (risk due to changes in natural conditions that occur gradually over time).
*8 Transition risk: The risk to an organization when there is inconsistency among the various entities in their actions aimed at reducing negative impacts on nature, such as restoring natural environments. For example, it could be triggered by changes in regulations, policies, technology, investor sentiment, or consumer attitudes. There are reputational, policy, and technical risks, among others.
[Analysis of priority locations for response in the company's business activities (direct operations)]
TNFD requires that priority response locations be identified in the organization's direct operations and at locations of activity in the value chain. It is recommended that priority locations be considered from the following two aspects.
A. Locations deemed to be ecologically sensitive (Sensitive locations)
B. Locations where the organization has identified material nature-related dependencies, impacts, risks and opportunities (Material locations)
Anritsu focused on priority locations by examining "manufacturing sites," which are assumed to be highly dependent on and impactful to biodiversity, and "business sites" and "development sites," which are assumed to have a large number of employees and high environmental impact.
Evaluated sites
| JAPAN | Atsugi site (ANRITSU CORPORATION, ANRITSU CUSTOMER SUPPORT CO., LTD., ANRITSU INFIVIS CO., LTD., ANRITSU DEVICES CO., LTD., ANRITSU KOUSAN CO., LTD., AK Radio Design, Ltd.: Atsugi, Kanagawa), Tohoku site(TOHOKU ANRITSU CO. LTD. first factory, second factory: Koriyama, Fukushima), Hiratsuka site (ANRITSU TECHMAC CO., LTD.: Hiratsuka, Kanagawa), Kawasaki site (TAKASAGO, LTD.: Kawasaki, Kanagawa), Tsuruoka site (TSURUOKA TAKASAGO, LTD.: Tsuruoka, Yamagata) |
| U.S.A. | Anritsu Company (California), Anritsu Infivis Inc. (Illinois) |
| U.K. | Anritsu EMEA Limited (Bedfordshire) |
| Romania | Anritsu Solutions S.R.L (Bucharest) |
| China | Anritsu Industrial Systems (Shanghai) Co., Ltd. (Shanghai) |
| Thailand | Anritsu Infivis (THAILAND) Co., Ltd. (Chonburi) |
Analysis of Areas of Concern for Biodiversity
Anritsu evaluated areas of concern based on the following criteria, referencing the TNFD definition and corresponding assessment criteria.
Our evaluation criteria
| Area | Criteria |
|---|---|
| Biodiversity importance | Comprehensive evaluation of the following indicators
|
| Ecosystem integrity *9 | Comprehensive evaluation of the following indicators
|
| Ecosystem service delivery importance *10 | Presence of areas important for the provision of ecosystem services to indigenous peoples and local communities |
| Water physical risk | Levels of the following indicators are evaluated individually
|
*9 Ecosystem integrity: Degree to which the composition, structure, and function of the ecosystem are healthy within the range of natural variability
*10 Ecosystem services: The benefits humanity derives from ecosystems. Specifically, this includes food and water supply, water purification, and soil erosion control.
*11 Protected areas and key biodiversity areas: Protected areas are areas protected by law or institutions, such as national parks. Key Biodiversity Areas (KBA) are areas recognized as scientifically important for biodiversity.
*12 STAR-T indicator: An indicator demonstrating potential contributions to reducing global species extinction risks. A high index indicates that an area supports the habitat for many species including endangered species.
*13 Biodiversity intactness index: An indicator of how many species remain compared to the natural conditions unaffected by human activities (e.g., land modification).
*14 Water stress: An indicator showing areas with low water availability
*15 Depth of flooding: Using the Flood Risk Finder jointly developed by MS&AD InterRisk Research & Consulting, Inc., the University of Tokyo, and Shibaura Institute of Technology, we used the flood depth distribution during a once-in-a-century flood occurring under the 2020 climate as an indicator. Inundation depth here indicates the height from the ground surface to the water surface when flooding occurs due to overflow from a river.
The evaluation results for each indicator are shown below.
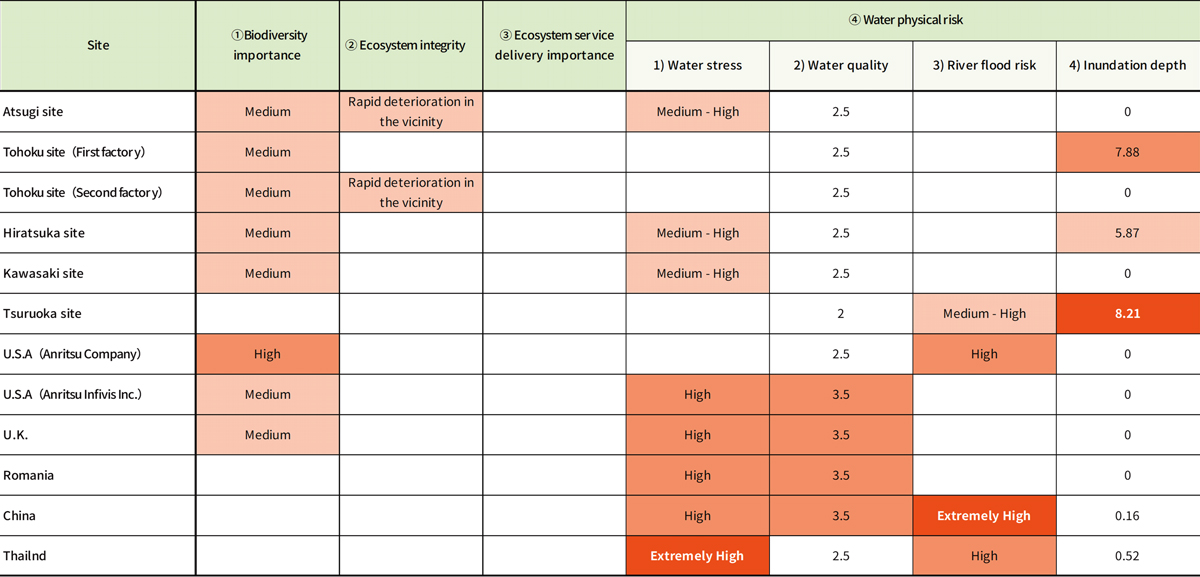
* Blank spaces indicate no applicable result or a rating lower than Medium.
The Atsugi Site is located in Atsugi City, Kanagawa Prefecture, within 5 km of the protected Kanagawa Prefectural Tanzawa-Oyama Quasi-National Park.
The Anritsu Company in Morgan Hill, CA, USA, falls under the STAR-T indicator for areas that support many endangered species and other threatened species. A significant decrease in tree cover was observed to have occurred at the Atsugi Site and around Tohoku Anritsu's second factory in the Tohoku Site.
For the physical risk of water, we focused on river flood risk and inundation depth based on our experience with flood damage at our manufacturing sites. As a result, we found that the manufacturing sites of Anritsu Company, as well as those in China and in Thailand, are at high risk of flooding, and that the first factory at the Tohoku Site and the Tsuruoka Site, which are located near rivers, have a high inundation depth during floods.
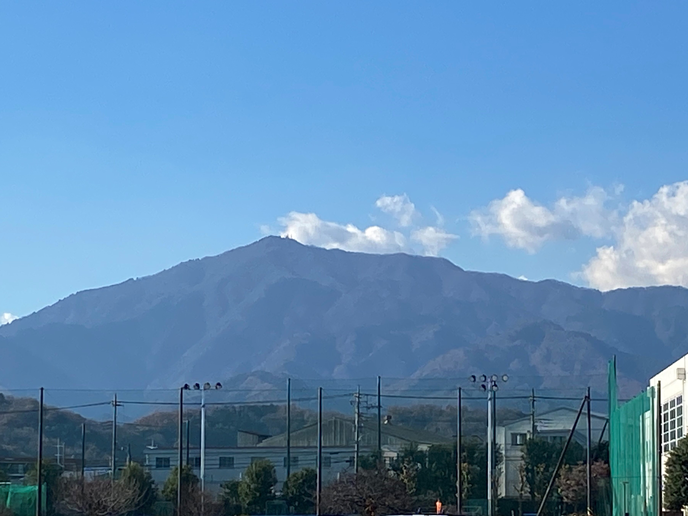
Mt. Oyama as seen from the Atsugi Site
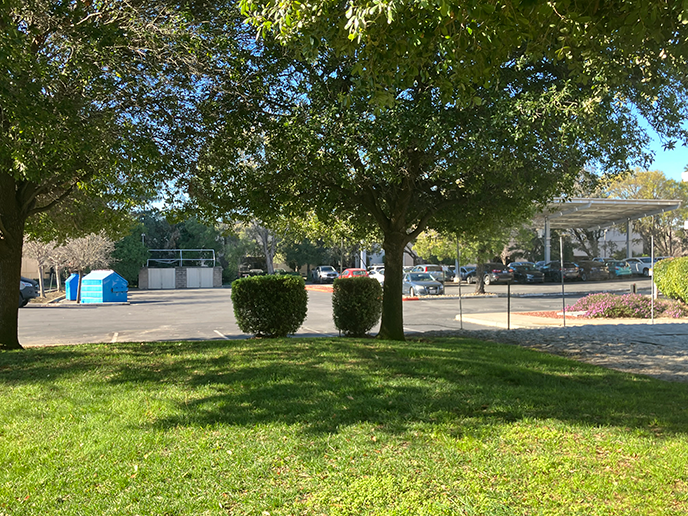
Green space at Anritsu Company
Analysis of Areas of Business Importance
Areas of business importance were evaluated primarily from the following perspectives.
- Sales, number of employees, and key locations for business operations
- High degree of environmental dependence and environmental impact
- Size of land use area
Locations with high sales and a large number of employees include the Atsugi Site with its development and manufacturing divisions, the Tohoku Site (Tohoku Anritsu's second factory), and Anritsu Company. The Atsugi Site, where the group's headquarters is located, was selected as a key location for business operations.
The high degree of environmental dependence and environmental impact were evaluated using "water withdrawal," "CO₂ emissions," "water discharge," and "waste generated" as indicators. This result is in proportion to the amount of sales and number of employees, and as above, three locations were identified: the Atsugi Site, Tohoku Site (Tohoku Anritsu's second factory), and Anritsu Company.
These three sites have a large land use area, which is expected to have a significant impact and ripple effect on the biodiversity of the region.
Priority Business Locations
After reviewing the results of the analysis of areas of concern for biodiversity and the analysis of areas of business importance, we have prioritized the Atsugi Site, the second factory at the Tohoku Site, and the U.S. Anritsu Company, which are highly rated for their importance in terms of biodiversity and ecosystem integrity, as well as for their business importance.
In FY2025, we will proceed with a detailed analysis of dependence and impact, assessment of risks and opportunities, and establishment of indicators and targets for the Atsugi Site and Anritsu Company.
Priority locations for action
| Priority locations for action | Atsugi site (Atsugi, Kanagawa) |
| Tohoku site (second factory, Koriyama, Fukushima) | |
| Anritsu Company (U.S.A.) |
Risk and Impact Management
Nature-related risks and opportunities are included in environmental risks, and integrated into the risk management system that comprehensively manages risks throughout the group. The Environmental Management Committee identifies significant items based on their impact and likelihood to occur, and identifies measures to address them. The results are regularly discussed and approved by the Management Strategy Conference and reported to the Board of Directors.
Anritsu will continue to assess the significance and priority of risks and opportunities in line with the LEAP approach and consider specific measures and initiatives.
Metrics and Targets
The Anritsu Group has linked and implemented the following environmental targets to core global disclosure metrics and additional global disclosure metrics required by TNFD. Going forward, targets and indicators will be established based on materiality and priority assessment of risks and opportunities.
Indicators for nature-related dependencies and impacts
| Metric Number | Driver of nature change | Indicator | Targets | Activities and results for FY2024 |
|---|---|---|---|---|
| - | Climate Change | GHG emissions | Reduce Scope 1+2 CO₂ emissions by at least 23% compared to FY2021 by FY2026 | 31.1% reduction |
| Responding to Climate Change | ||||
| - | Climate Change | GHG emissions | Reduce Scope 3 Category 1 and Category 11 CO₂ emissions by at least 17.5% compared to FY2019 by FY2026 | 37.3% reduction |
| Responding to Climate Change | ||||
| - | Climate Change | GHG emissions | Increase in ratio of private solar power generation (Anritsu Climate Change Action PGRE 30): 14% or more in FY2026 | 12.5% |
| Responding to Climate Change | ||||
| C2.2 | Pollution/pollution removal | Waste generation and disposal | Reduce the amount of industrial waste generated by the Domestic Anritsu Group by 3.5% or more per unit of sales compared to FY2019 by FY2026 | 21.6% reduction |
| Resource Recycling | ||||
| C2.2 | Pollution/pollution removal | Waste generation and disposal | Maintain zero emissions of waste (less than 0.5% of waste directly landfilled or simply incinerated) for the domestic group | Maintain zero emissions |
| Resource Recycling | ||||
| C2.3 | Pollution/pollution removal | Plastic pollution | Reduce the use of plastic bottled beverages by half by FY2026, based on FY2021, and implement bottle-to-bottle recycling for all plastic bottles *Usage in the base year: 5.7 tons |
2.7t |
| Bottle-to-bottle recycling rate:100% | ||||
| Resource Recycling | ||||
| C2.3 | Pollution/pollution removal | Plastic pollution | By FY2026, we will reduce by half the use of fossil-based virgin plastic by reducing or eliminating the use of plastic packaging materials and replacing them with plant-derived or recycled materials. In addition, we will endeavor to collect and reuse or outsource the recycling of plastic packaging materials. | Reduce use of virgin plastic by 36.8% |
| * Calculated as a percentage of sales based on FY2021 usage | Resource Recycling | |||
| C2.3 | Pollution/pollution removal | Plastic pollution | By FY2026, we will reduce the volume and weight of plastic packaging materials used for purchased parts and materials, and promote the replacement of such materials with plant-derived or recycled materials, as well as the recycling of all materials. | Request briefings and cooperation from suppliers |
| * Calculated as a percentage of sales based on FY2021 usage | Resource Recycling | |||
| C2.3 | Pollution/pollution removal | Plastic pollution | By FY2026, we will promote the material recycling of food packaging plastics used in cafeterias. | Material recycling rate:100% |
| Resource Recycling | ||||
| C2.4 | Pollution/pollution removal | Non-GHG air pollutants | Comply with regulatory standards at the Tohoku Anritsu first factory, which has a soot and smoke facility subject to the Air Pollution Control Act. | Prevention of Air Pollution |
| A3.0 | Resource use and replenishment | Total water consumption and withdrawal | Reduce the total amount of water withdrawal by the Domestic Anritsu Group, Anritsu Company (U.S.), and Anritsu EMEA Limited (U.K.) by 2.2% or more compared to FY2019 by FY2026 | 24.3% reduction |
| Water Usage Data |