Example of utilizing QUICCA: VOL. 8
To the management and executives of food factories,
Visualize the efficiency of production equipment using OEE

Introduction
In this article, we would like to talk about "visualization" that has advanced one step further. We think you regularly graph indicators such as "operational availability of production equipment," "number of products per unit time," and "acceptance rate at final inspection," and compare them with those of a different production line or the previous month's results from the same line. What do you often notice when you compare the graphs? For example, "the number of products has not increased in proportion to the operating hours of the equipment," or "the yield of this product line seems to have decreased compared to last month." It is relatively easy to visualize a single indicator, for example, by focusing only on the number of products or the yield. But if one graph showing an increase in the number of products compared to the previous month and another graph showing a decrease in yield compared to the previous month are obtained at the same time, what should we do? We can't honestly be happy with such a result. When different graphs appear for each indicator, it may be difficult to comprehensively assess whether or not production equipment is being utilized effectively.
Don't you think it would be convenient if you could comprehensively assess the effectiveness of utilization of production equipment? To prepare for this, let's look at the planned values for "operational availability," "performance," and "quality" indicators.
| What is to be measured |
Indicator |
Planned value (example) |
| (1) Planned operating hours for the production equipment |
Operational availability |
(1) 180 minutes |
| (2) Maximum production capacity of the production equipment |
Performance |
(2) 100 products/min |
| (3) Planned number of products (PASS products only) |
Quality |
(3) 9500 products |
*The planned operating hours of the production equipment shall not be adjusted due to increases or decreases in order quantities. This article uses operational availability that focuses on the machine's capacity rather than "operating ratio."
Let's say you have measured actual values for two types of equipment. The results are shown below. Which equipment do you think has produced more efficiently?
| |
Actual operating hours |
Products/minute |
Number of acceptances |
| Equipment A |
160 minutes |
85 products |
9300 products |
| Equipment B |
165 minutes |
80 products |
9300 products |
1. Assessment using OEE (Overall Equipment Effectiveness)
Equipment A and Equipment B have the same number of acceptances, but there are slight differences in the actual working hours (minutes) and products/minute. There are longer actual operating hours for B and more products/min for A. It is difficult to determine which equipment has produced more efficiently. However, even if there is a small difference, the problem of inferior equipment should be identified as soon as possible and efforts should be made to solve it. You can calculate the efficiency of your production equipment using simple calculations. This is OEE (Overall Equipment Effectiveness).
[How to calculate OEE]
The OEE of the entire production line can be evaluated based on the data obtained from the product inspection equipment. To do so, we define the "operating time" as the time during which one or more products pass through the inspection equipment per minute, not the operating time of the inspection machine itself. With the planned value as the denominator and the actual value counted by the inspection machine as the numerator, multiply the three indicators.

*The number of products (planned value) shall be the number of products that passed through the inspection machine.
Let's apply actual values to the above formula.
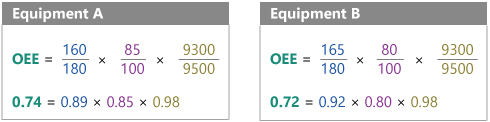
As a result, it can be said that Equipment A has a higher production efficiency.
Now, let's review the indicators that make up OEE and the formula.


2. Infer what is happening in the upstream equipment based on the OEE of the inspection machine
As shown in the figure below, in a general production line, multiple devices are arranged in series, and if continuous defects are generated in one device, the number of products flowing in the downstream section should inevitably decrease. For example, if a packaging machine stops for a while due to malfunction of a filling machine or a setup change, products will not flow to the downstream inspection machine during that time. In this context, the efficiency of the entire line can be determined by looking at the OEE of the device at the end of the line, such as the checkweigher.
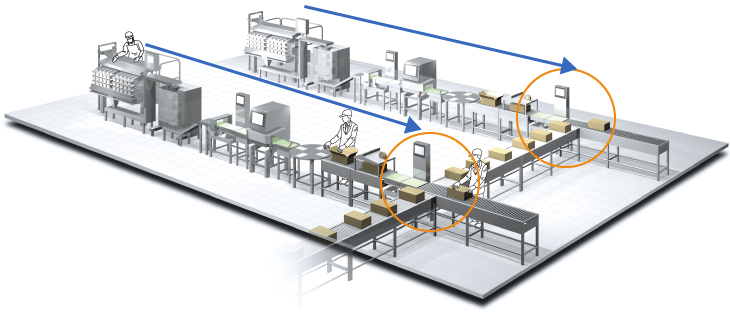
The following are examples of inferring what is happening upstream based on OEE and each indicator (availability, performance, quality) calculated from Checkweigher data.




3. With QUICCA, you can "visualize" the OEE of each piece of equipment.
QUICCA collects real-time measurement values and judgment results from up to 99 devices (production machines, inspection machines), enabling remote aggregation and analysis. QUICCA not only shows the operating status and inspection records of multiple devices in real time, but also displays OEE calculations and graphs at any time. It is also easy to include OEE graphs in daily and monthly reports.
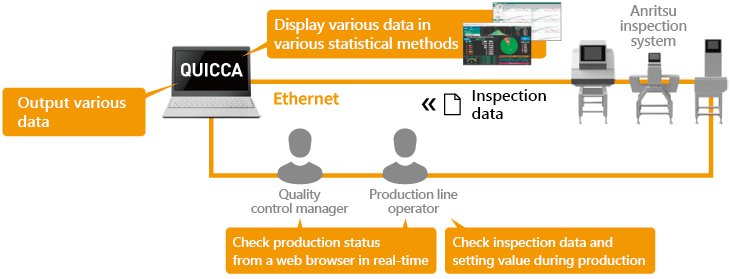
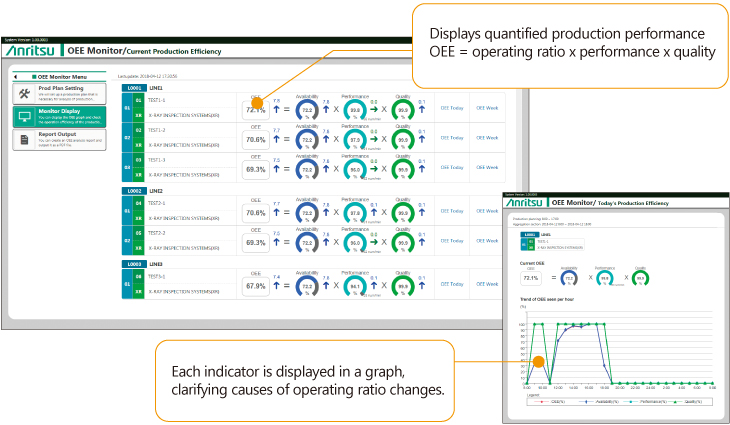
Example of an OEE display
Summary
OEE is calculated by multiplying each ratio of the actual value (numerator) to the planned value (denominator) for the three indicators. It is not possible to simply compare the OEE of a mass production line with the OEE of a small-volume production line, where the ratios fluctuate greatly, but it is reasonable to compare the past and current efficiency of a production line and the efficiency of lines producing the same product. Since OEE can be intuitively understood by those who are not specialized in production technology, it can facilitate improvement activities in the entire workplace. In addition, the limits of improvement activities can be grasped according to OEE trends, so it is possible to make a rational decision on whether or not equipment should be renewed immediately. QUICCA software enables real-time OEE monitoring and facilitates detailed OEE analysis with the graphical charts and reports.
Related page
QUICCA usage example: List page >
QUICCA product page >
