
Is the choice of algorithm appropriate?
Most of X-ray inspection users in the food industry may not be so particular about choosing the algorithm (method) when setting the detection sensitivity as long as the in-house criteria (the type and size of test pieces to be detected) are satisfied.
Wouldn't you be interested in trying a different algorithm if detection sensitivity surpassing the internal standards can be achieved?
Each product has characteristics such as overlap, steep edges, granularity, linear shape, etc., and image processing is performed to erase (reduce) the product effect. This is the "Contaminant Detection Algorithm", and by selecting the most suitable one for the product, the detection sensitivity can be improved. This can minimize complaints from consumers and business partners and strengthen quality assurance. In this paper, we will explain the difference in detection sensitivity due to the selection of the "Contaminant Detection Algorithm" using easy-to-understand examples.
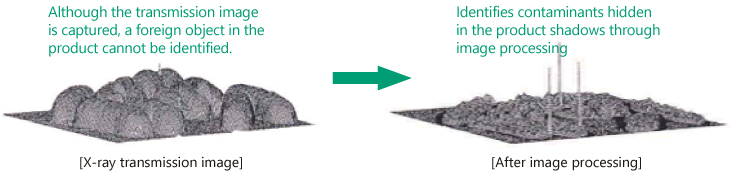
Image processing mechanism
With the transmission image (a raw image) shown in the left, an X-ray system cannot determine whether foreign bodies are hidden in the product. Therefore, according to the characteristics (density, shape, material) of the product and the physical properties of contaminants to be detected, the product effect and noise of the product are reduced, and advanced image processing is performed to accurately extract only the signal of the contaminant. This optimal combination of image processing is called a "Contaminant Detection Algorithm".
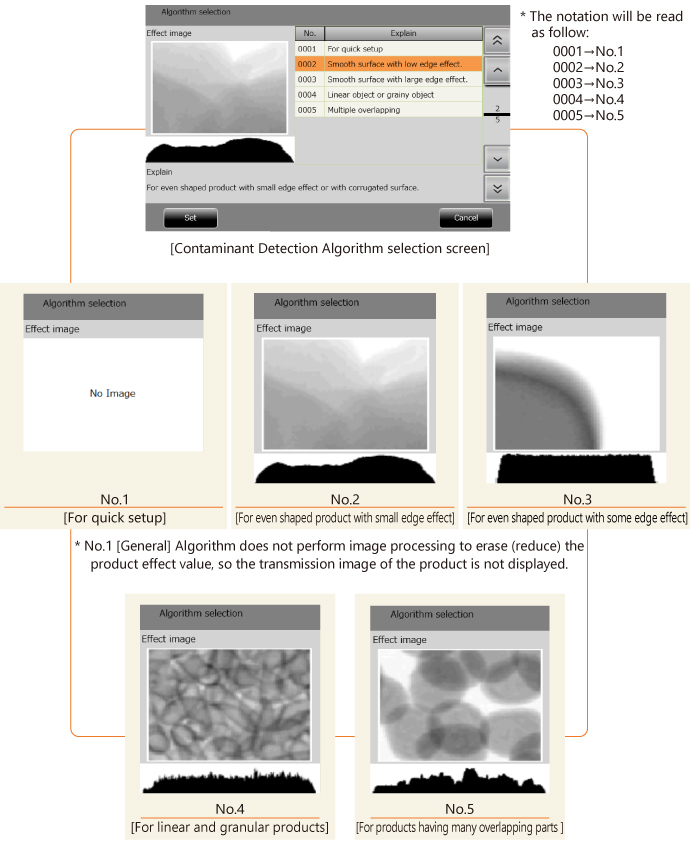
Selection of Contaminant Detection Algorithm
For easy reference, we use our current model, XR75 Series X-ray Inspection System, to explain the "Contaminant Detection Algorithm".
- When registering the product with a different algorithm, select one of the five "Contaminant Detection Algorithms" displayed on the operation screen. First, read the effect images and description to roughly grasp the characteristics of each algorithm. Next, obtain the transmission image of the product and select a contaminant detection algorithm suitable for the product. Since the description of the algorithm is just guidelines for selection, it is better to try multiple algorithms instead of one, compare the detection sensitivity of each, and select the one that can best detect foreign bodies and test pieces.
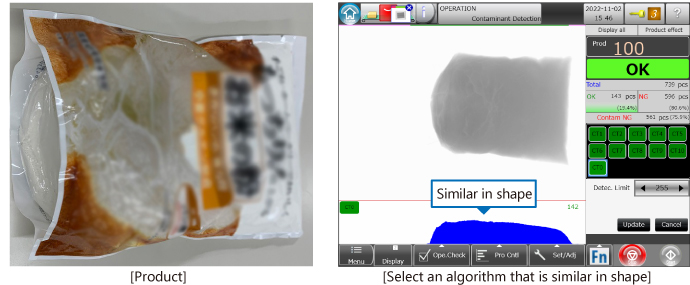
- On the setting screen, select a product number that you do not normally use, and feed products into the X-ray inspection system. Memorize the shape of the x-ray image of the product displayed on the X-ray indicator.
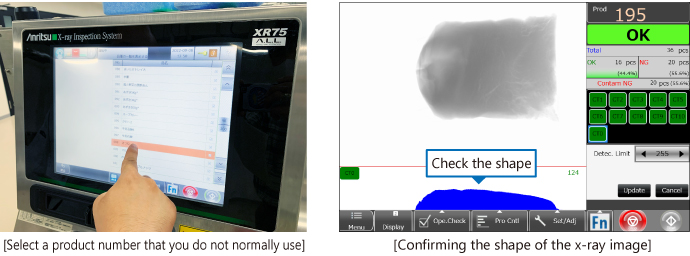
- If the shapes of the effect image selected from the "Contaminant Detection Algorithm" in the step 1 and the x-ray image of the product are similar, you are close to making the right choice. If they are different in shapes, you may have selected a wrong algorithm.
Difference in Detection Sensitivity by Contaminant Detection Algorithm
We used the same product to demons tr ate the difference of detection sensitivity between SUS wire and SUS ball test pieces according to a choice of Contaminant Detection Algorithm.
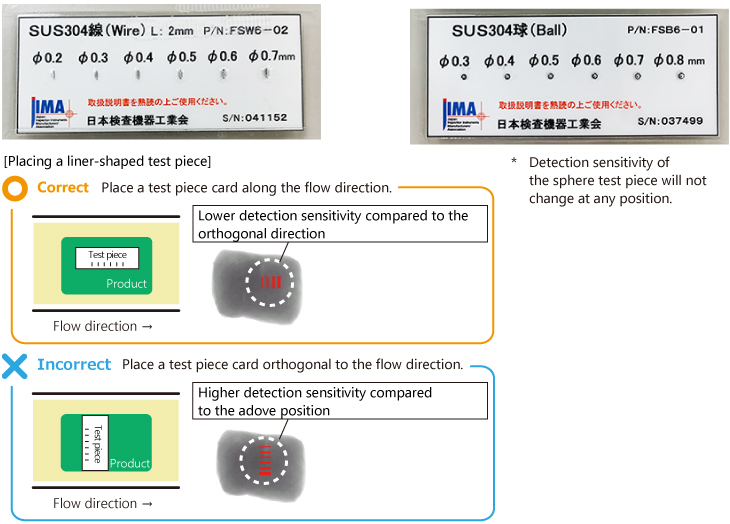
Case 1: Frozen Dumplings
Frozen dumplings are familiar to supermarkets and self-checkout stores. Which algorithm do you think is the best?
We selected No. 4 [for linear and granular products] because the edges of dumplings have a linear shape, and No. 3 [For flat products with large edge effects] because the effect can be large on the edges of the dumplings in a frozen condition. Since we could not decide which one to use, we tried with both algorithms.
- No.4 [For linear and granular products]
SUS wire with a diameter of 0.4 mm, SUS ball with a diameter of 0.4 mm
- No.3 [For flat products with large edge effect]
SUS wire with a diameter of 0.3 mm, SUS ball with a diameter of 0.4 mm
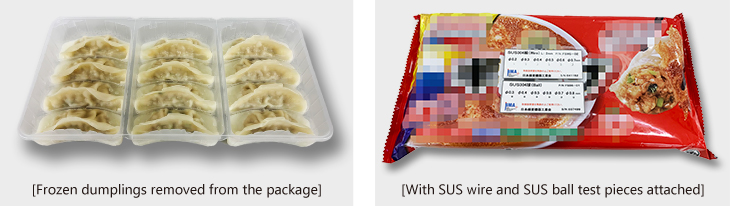
As a result, No. 3 [for flat products with large edge effect] was one rank higher in SUS wire. However, depending on the type of dumpling and contaminants to be identified, No.4 [For linear and granular products] may generate better detection results.
![No. 3 [for flat products with large edge effect]](https://dl.cdn-anritsu.com/images/infivis/en-en/knowledge-center/technical-note/vol18/technical-note-vol18-img8-en.jpg)
Case 2: Ramen noodle in a carton
In Japan, ramen noodles placed in a fancy box are sold in souvenir shops at airports or supermarkets. When inspecting ramen noodles, you may want to select No.4 [for linear or granular products] since the noodles are liner shape, or select No.3 [For flat products with strong edge effects] by considering the influence of carton rim edges.
However, the seasoning sachets and the noodle can contain salt, oil, and liquid sauce, and they are packed in layers, resulting in unevenness. The x-ray image shows that part of carton edge is lighter, and the part of content is darker. Also, please see the carton edges circled in green in the figure below. The effect of the left and right carton edges are small, but the inner contents becomes bigger.
Under these conditions, it is appropriate to use No.5 [for products having many overlapping parts].
The following was tested with No.4 [for linear and granular products] and No.5 [for products having many
overlapping parts].
- No.4 [For linear and granular products]
SUS wire with a diameter of 0.4 mm, SUS ball with a diameter of 0.5 mm
- No.5 [For products having many overlapping parts]
SUS wire with a diameter of 0.4 mm, SUS ball with a diameter of 0.4 mm
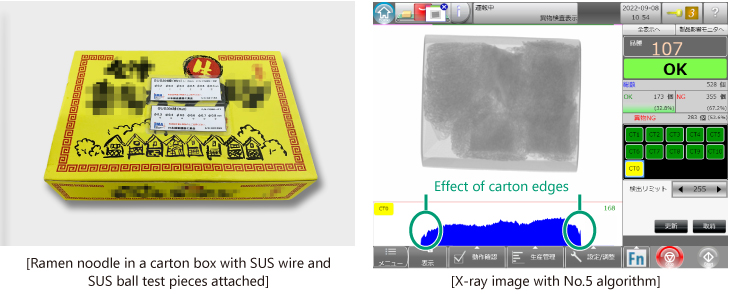
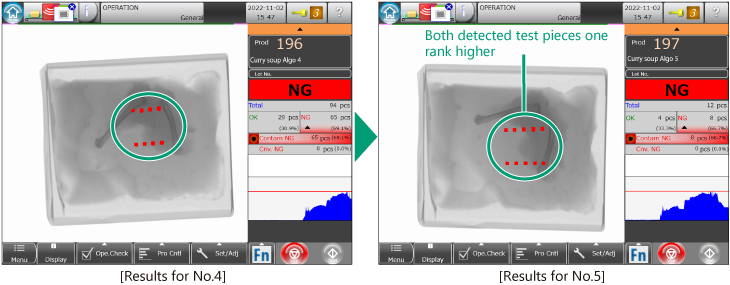
As a result, the X-ray system detected both SUS wires with a diameter of 0.4 mm in both algorithms, but for SUS balls, No. 5 [for products having many overlapping parts] detected a diameter of 0.4 mm, which is one rank higher.
![No. 5 [for products having many overlapping parts]](https://dl.cdn-anritsu.com/images/infivis/en-en/knowledge-center/technical-note/vol18/technical-note-vol18-img10-en.jpg)
Case 3: Curry soup with chicken thigh
There are so many product items that you cannot put into same category when it comes to curry in retort pouches. Since the contents of aluminum packaging cannot be seen visually, we select the optimal algorithm based on the shape obtained by touching and the x-ray image of the actual product.
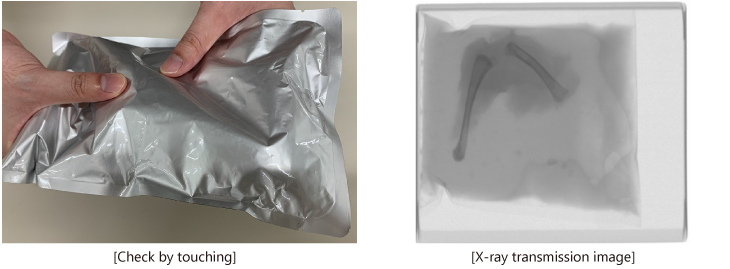
The item to be inspected this time is curry soup containing a whole chicken thigh. When you see the shape of the x-ray image, the product effect value of the contents is higher than the effect value of the carton; therefore, it is suitable to select No.5 [For products having many overlapping parts].
![No.5 [For products having many overlapping parts]](https://dl.cdn-anritsu.com/images/infivis/en-en/knowledge-center/technical-note/vol18/technical-note-vol18-img14-en.jpg)
The following was tested with No.4 [for linear and granular products] and No.5 [for products with having many overlapping parts].
- No.4 [For linear and granular products]
SUS wire with a diameter of 0.4 mm, SUS ball with a diameter of 0.5 mm
- No.5 [For products with having many overlapping parts]
SUS wire with a diameter of 0.3 mm, SUS ball with a diameter of 0.4 mm
As a result, No.5 [for products with having many overlapping parts] was one rank higher.
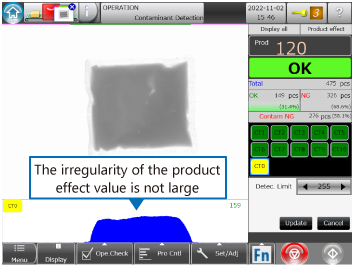
In addition, it is preferable to select No.2 [For flat products with low edge effect] if the unevenness of the product effect value is not large as shown below.
Conclusion
We hope this paper helped you understand the difference in sensitivity depending on the selection of the Contaminants Detection Algorithms. The explanation of contaminant detection algorithm is intended as a guide only, so the optimal algorithm is the one that can detect the test piece you want to detect or the foreign body most effectively. How about comparing and verifying the same inspected product with different "Contaminant Detection Algorithms"?
In the next issue, Vol.19, we will introduce the content on the theme of "detection limit" and "noise removal limit" that are used in sensitivity adjustment after automatic setting.
Related Links
PDF >
Technical Note (For general use) >
Products & Solutions > X-ray Inspection >
 X-Ray Inspection >
Glossary: X-ray Inspection System >
X-Ray Inspection >
Glossary: X-ray Inspection System >
